Your Virtual Reach Score
Virtual Reach Score™
When evaluating the performance of a virtual event, marketers face a sea of uncertainty.
What is your virtual event’s true value in your marketing mix? Should you shift resources from traditional channels to digital customer experiences? What is the real marketing ROI? How did your virtual event make your attendees feel? Did the time spent with the brand create more memorable engagement than an ad campaign?
Bottom line: how do you quantify the true reach, relevance, and engagement with your stakeholders?
For almost five years, closed social media platforms have had the ability to analyze actual reach past the first interaction within closed ecosystems (Facebook, LinkedIn, etc.). The challenge for marketers lies with calculating total reach, or reach amplification, of a virtual broadcast that’s open to anyone with a browser on the world wide web. This is in contrast to the availability of those metrics in a closed ecosystem; for instance, Google only reports the first interaction.
Simply put, if more targets are interacting with your brand and many of them sample, try or discover more, then the value of identifying the actual reach helps advise the optimal mix for your marketing and advertising budget.
Why is Virtual Reach Score so significant?
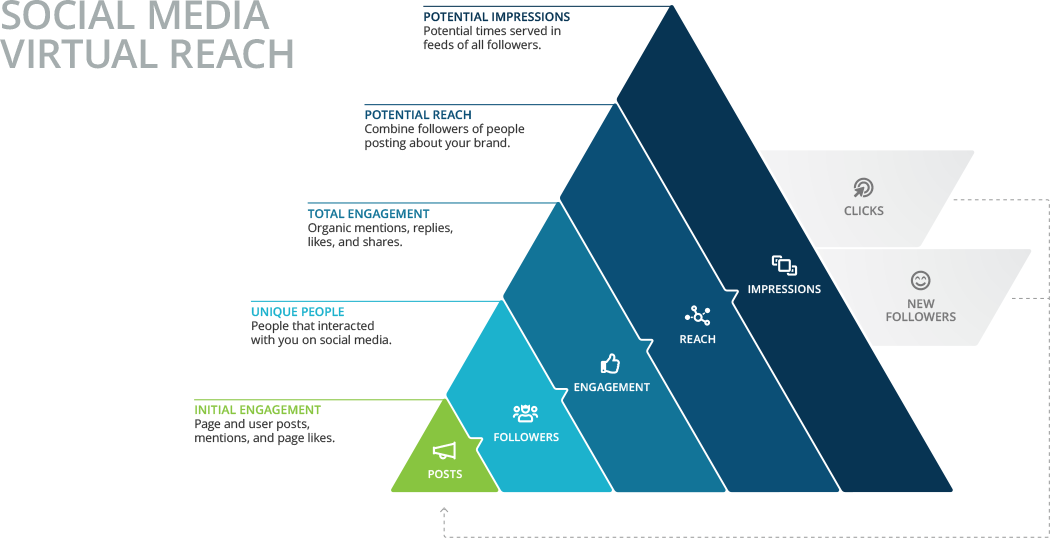
Reach is a key metric that is based on the number of unique users exposed to your content. While Google and social media platforms both provide analytics on reach, the extent to which they report reach vastly differs. Social platforms report total reach that includes tertiary viewers, while Google only reports the views from the direct link.
Facebook’s concept of viral reach best explains how Virtual Reach Score accounts for reach amplification. Measuring viral reach of a virtual event consists of accounting for all people who viewed the content.
Simple measurements of reach only consider those who received a direct link to the content, and disregard anyone who was exposed to the content by a third party (anyone other than the one who received a direct link from the source). In other words, viral reach considers the number of people who have seen, liked, or shared a post, or clicked a link after a friend of theirs interacted with the original post.

Similarly, LinkedIn notates reach as revolving around impressions, the number of times that your content is seen by LinkedIn users on their feed. This includes direct content and secondary content liked/commented/shared by connections.
The Virtual Reach Score™ measures reach and engagement by not only accounting for the initial interaction, but all interaction points after the link is shared.
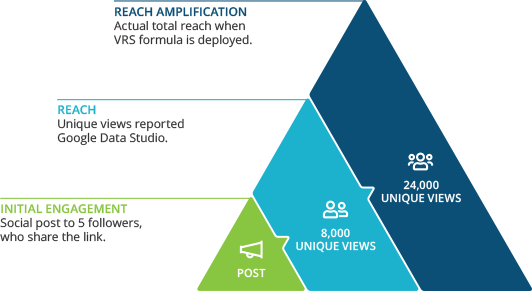
For example: What happens when someone shares a link with five people and those five people also share the link? Google Data Studio reports 8,000 unique views for a virtual event, but once the VRS formula is deployed to compute actual total reach, we can determine that the reach amplification was actually 24,000.
It is now possible to measure virtual event interactions and downline behaviors with the newly emerged Virtual Reach Score (VRS). This new AI-driven measurement system was developed to quantify the reach and engagement of convergent technologies, like AR and VR, and consider new best practices to identify the true marketing ROI of a streamed event.

KPIs for Calculating Virtual Reach Score
Plenty of performance indicators can be used to calculate ROI. For instance, when engaging in eCommerce, some KPIs include: Orders, Average Order Value, and customer LTV. But when it comes to the impact of a virtual event streamed across the world and its downline lifetime effect on brand sentiment, quantifying true, real reach and resonance has previously been uncharted waters.
Virtual Reach Score calculates the amplification of actual brand engagement based on a net ROI formula calculated from known, measurable standard KPIs. These KPIs include:
| KPI | SOURCE |
|---|---|
| Number of meaningful brand impressions | |
| Number of conversations | |
| Number of video views | |
| Number of video viewers | |
| Number of solicited viewers | |
| Number of solicited views | |
| Number of viewer groups | |
| Rate of viewers per viewing group | |
| Average rate of viewers per viewing group | |
| Number of cities reached |
| KPI | SOURCE |
|---|---|
| Number of countries reached | |
| Number of U.S. cities reached | |
| Number of non-U.S. cities reached | |
| Number of states/territories reached | |
| Ratio of viewers per city in top 10/25/50 cities | |
| Ratio of viewers per top five states/territories | |
| Ratio of viewers per country in top three countries | |
| Number of shares | DefaultFactor™ |
| Number of unsolicited viewers | ViewershipFactor™ |
| Number of unsolicited viewers in viewing group* | ViewershipFactor™ |
* This metric is calculated by counting the number of unique devices that display campaign content beyond the original Solicited Viewer’s devices (conservatively up to three devices: mobile, desktop, tablet).
Multiple Viewership Model
As with any accurate ROI formula, the key is dynamism. Formulas must be customizable or tailored for the event, distribution methods, and type of event.
Email and Using Unique IDs with Marketing Analytics
Leveraging legal data collection with unique digital IDs is the first and core building block of many steps driving the Virtual Reach Score ROI formula.
Unique IDs should be appended to each contact via contact record on the distribution lists or within the CRM, with a particular focus on the individual target audiences within the larger cohort. The unique IDs are later used to anonymize PII, which protects user privacy, when presenting KPIs and insights. Campaign-specific tracking pixels are added to each email, with the unique ID set as a custom dimension in analytics reporting. When a user’s device downloads an image from the server, the server reports an email “open” event for that particular user. The unique IDs also allow the data to be grouped by segmentation or any other dimensions found or created within the contact record.

DefaultFactor™
Accounts for progressive email opens beyond the original recipient.

BlockRateFactor™
Assumes the appropriate percentage of viewers who block automatic image downloads (unique user ID tracking).
Each event, based on the type of event and nature of syndication, must have a reasonably assumed email open rate determined. The standard number of devices in the formula defaults to no more than three devices. This factor can be adjusted based on the type of audience or syndication factors.
With this DefaultFactor™, progressive email opens beyond three devices with the same IP address indicate an additional person opening an email shared by the original recipient. Such email-forwarding behavior is commonplace when it comes to spreading awareness about a major event to business associates, family, and friends.
The formula also requires the calculation of BlockRateFactor™. The block rate assumes the appropriate percentage of viewers block automatic image downloads on their device, which blocks email open tracking and skews data downward. For example, within a given date, an email open rate is reported as 39% de jure. But since some opens are undetectable, the open rate is de facto greater than 40%. In this case, we only report 39%, but footnote the assumptions.
While data collection methods vary, we have established specific KPI development on each and every project published after decades of aggregating analytics from all major industry sectors. It allows us to use experienced, secure, internal systems where clients own their own data, which is totally invisible to the outside world. For email, promoting a live or streamed event, we can select these default KPIs for analysis:
- Number of emails sent
- Number of unique email opens per unique ID
- Number of total email opens per unique ID
- Average Unique Amplification Rate (Amp. Rate)
Video Geographic Audience Viewership Factors
Then, we must adjust and align to develop the GeoVideoFactor™. Depending on the type of syndication and channels used, this requires a situationally adjusted formula to count the true, de facto audience. As a default, the VRS relies on more high-level KPIs that demonstrate geo-locational impact for multi-video campaigns:
- Number of cities reached
- Number of states reached
- Number of countries reached
- Number of views by region, city, school, and device
- Percentage of views by browser
Next we add in the ViewershipFactor™. When individual videos are analyzed, we study KPIs that demonstrate individual video performance:
- Number of views per video
- Number of viewers per video play
- Number of views per campaign
- Hours, minutes, and seconds of watch time per video
- Hours, minutes, and seconds of watch time per channel as this total time increases the channel rank in YouTube’s search engine
- Average audience retention per video

GeoVideoFactor™
Situationally adjusted to count the true, de facto audience by relying on high-level KPIs that demonstrate geolocational impact.

ViewershipFactor™
Uses individual video KPIs to analyze viewership.
Understand Your Virtual Event’s True Reach with Virtual Reach Score
As practitioners of demographic, psychographic, and behavioral targeting, we understand the effects of stirrings the human heart on behalf of a brand. It is now possible to measure the interactions and downline behaviors with the newly emerged Virtual Reach Score (VRS). Learn more about our methodology that provides astounding marketing ROI.
Let us help you curate your virtual event from start to finish with our Hybrid Reality virtual platform offering. With Hybrid Reality, business intelligence is integrated into every aspect of event communications, creating greater return on your investment. Plus, this means you’ll have the pros performing passive monitoring and data analysis. In addition to computing your Virtual Reach Score, after your event, we provide analytics on average time attendees/users viewed exhibitor booths, impressions, and overall experience your attendees had. Additionally, you will receive a full report of what digital collateral/souvenirs people downloaded for you to leverage for future events.
Discover the true marketing ROI
of your virtual event.
Calculate your VRS
Contact Us
Looking for more insight? Don't be shy,
contact us to enter a world of marketing ROI potential.
